I’ve just handed a statistics assessment, and I figured you’d all want to hear about it. If you hate statistics, I sincerely apologise for this blog post. I promise I’ll try to make it sound interesting!
For this assessment, we had to create a power point presentation explaining a statistics topic of our choice. I just wanted to make sure I chose a decently interesting topic, but it ended up blowing my mind.
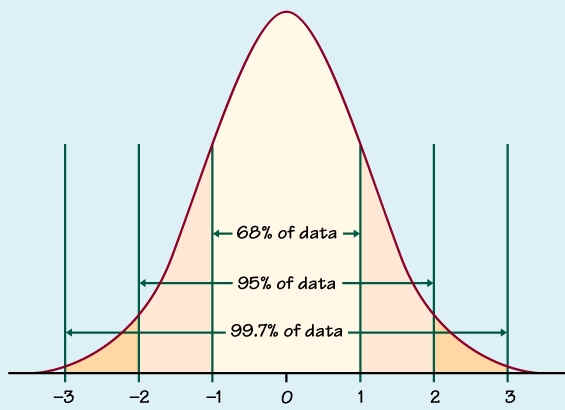
The Central Limit Theorem (or CLT) says that if you were to take a bunch of same size samples from a population and plot them in a graph, you would get a normal distribution. That doesn’t mean much, so let me break it down.
Imagine that out of all the bloggers on WordPress, we took a group of 30 of them and counted how many posts they published this month .

Then we took another sample of 30, and did the same thing. Then another, and another, and another, the more samples we took, the better.
Here’s the thing. If we were to count pretty much any characteristic that we got from each set of 30 – the average number of posts, the highest number of posts, or the most popular number of posts – and put them in a graph, that graph would be a normal distribution.

No matter what part characteristic we pick or how crazy the numbers from the samples are, the CLT gives us this nice little bell curve that just tells us so much. We could discover a lot about people’s posting habits and how they compare to ours, just because of this funky little theorem. The shape of the bell curve tells you that most people are around the middle somewhere, packed around the average, and there are only a select few people up at the top edge.
The thing about WordPress is that are a whole lot of people that start a blog and forget about it. Some of them would be included in our groups of 30, so that would pull the average right down. There are a few people like me who are trying to post regularly, but there just aren’t enough of us to pull the average up.
With that in mind, the average post of all WordPress accounts is apparently 3 posts PER YEAR (source). That’s one post every 4 months. That’s it. If you’re posting more than that, you can give yourself a pat on the back. Statistically, we’d probably have take out all of the forgotten accounts to be able to get a normal result. The average without them is sure to be a little higher, but I dare say not by much.
I’ve always had this massive urge to know as much as possible about how I compare to others. I want to know if I’m first or last, how many people got the same mark as me, if I’m just like everyone else or whether I’m actually special.
The Central Limit Theorem helps me to know that I am.
